
The State of Fintech: 100+ Statistics That Define Digital Payments in 2026
We've put together over 100 fintech statistics across several critical areas. For anyone building, running, or investing in financial services, these statistics provide the hard evidence needed to make strategic decisions. They show you where the market is heading, what customers will tolerate, a...
We've put together over 100 fintech statistics across several critical areas.
For anyone building, running, or investing in financial services, these statistics provide the hard evidence needed to make strategic decisions. They show you where the market is heading, what customers will tolerate, and how fast you need to move to stay competitive.
The financial services industry isn't just changing but practically being rebuilt from the ground up.
Cash is disappearing. Physical branches are emptying. And an entire generation has decided that if they can't pay with their phone, they'll shop somewhere else. This isn't a future scenario. It's happening right now.
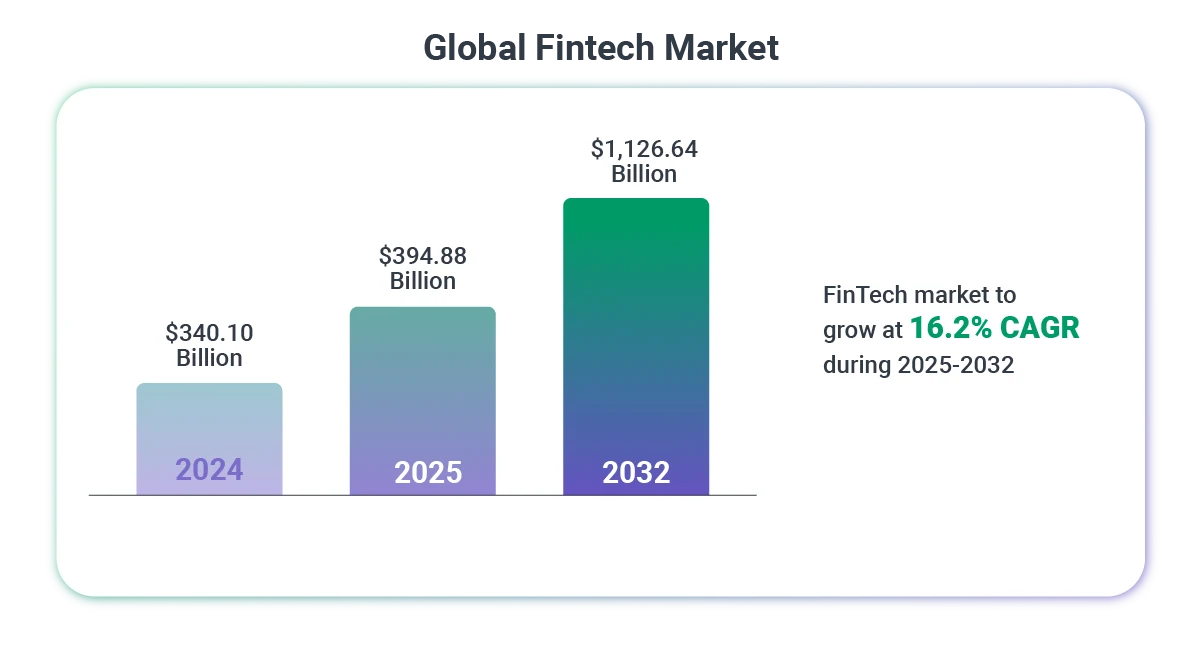
The global fintech market is projected to hit over $1 trillion by 2032. Digital payments have completely flipped the script on cash and cards in just ten years. These aren't isolated trends – they're symptoms of a fundamental rewiring of how money works.
This collection brings together over 100 fintech statistics across several critical areas. For anyone building, running, or investing in financial services, these statistics provide the hard evidence needed to make strategic decisions.
These stats show you where the market is heading, what customers will tolerate (and what they absolutely won't), and how fast you need to move to stay competitive.
1. MARKET OVERVIEW & GROWTH PROJECTIONS
The fintech boom isn't slowing down – it's accelerating. Here's what market projections reveal:
- The global fintech market is projected to be worth $394.88 billion in 2025 and reach $1,126.64 billion by 2032, exhibiting a CAGR of 16.2%. North America dominated the global market with a share of 34.05% in 2024. [Fortune Business Insights]
- The United States digital payment market is projected to grow from $3.06 trillion in 2024 to $9.29 trillion by 2033, representing a compound annual growth rate of 13.11%. [Research and Markets]
- The embedded finance market is estimated at $85.8 billion in 2025 and projected to reach $370.9 billion by 2035, representing a compound annual growth rate of 15.8%. [Future Market Insights]

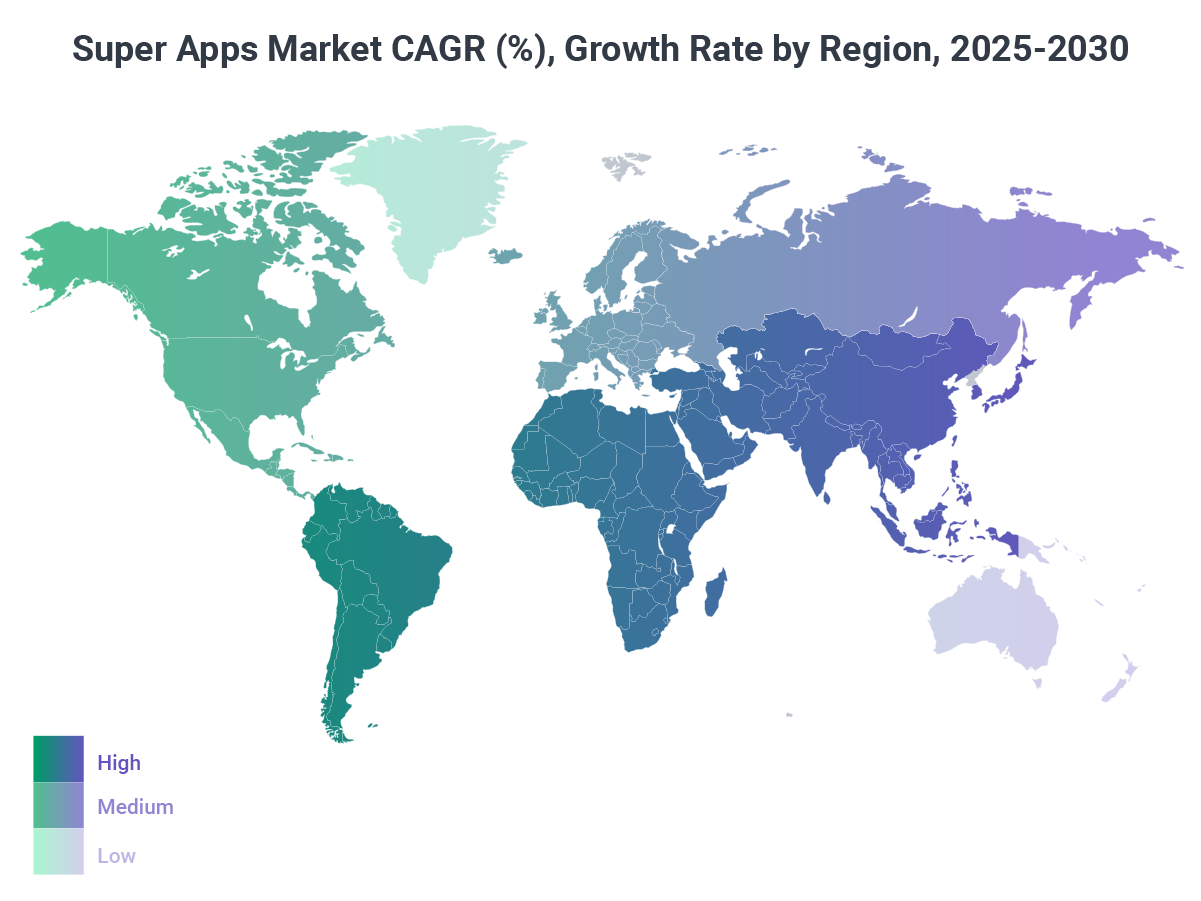
- The super apps market is valued at $127.46 billion in 2025 and forecast to reach $440.19 billion by 2030, advancing at a compound annual growth rate of 28.13%. [Mordor Intelligence]
- While AI has accounted for more than half (58%) of VC investments in 2025, AI-enabled fintech startups have accounted for 30% of total VC investment. [Silicon Valley Bank]
[BCG]
2. Consumer Payment Preferences & Behaviors
Market growth is one thing, but consumer behavior tells the real story. The way people actually pay for things has fundamentally changed – let's take a closer look at the numbers:
- 70% of consumers consider the availability of their preferred payment method "very or extremely influential" when deciding which merchant to use for online purchases. [Worldpay and PYMNTS]
- Digital payments grew from 34% of e-commerce value in 2014 to 66% in 2024, precisely reversing the share held by cash and cards over this decade. [Worldpay]
- Digital payments expanded from 3% of global in-person shopping value in 2014 to 38% in 2024. [Worldpay]
- Mobile's share of global e-commerce tripled from 19% in 2014 to 57% in 2024. [Worldpay]
- The value of global e-commerce transactions grew more than sixfold from 2014 to 2024. [Worldpay]
- Digital wallet value grew approximately tenfold, from $1.6 trillion in 2014 to $15.7 trillion in 2024. [Worldpay]
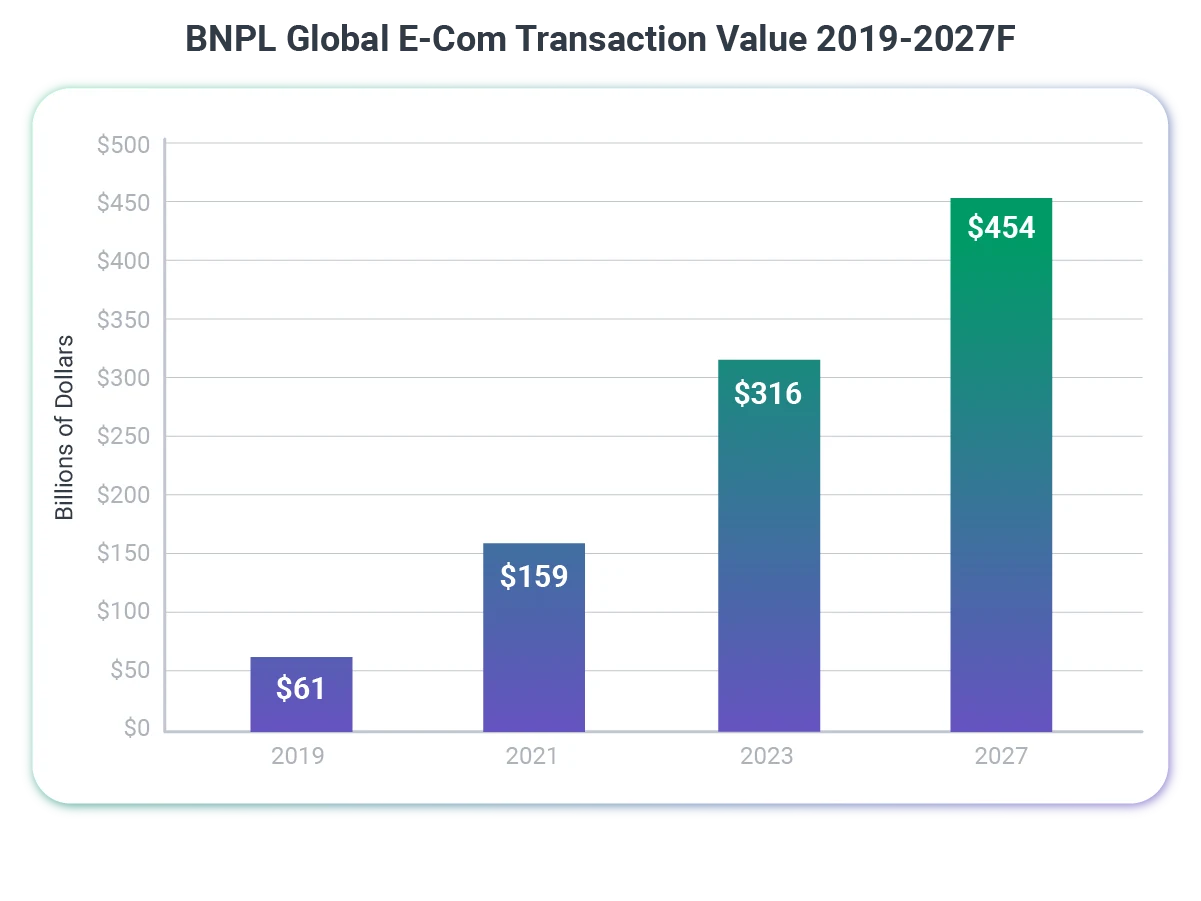
- BNPL e-commerce value grew from $2.3 billion in 2014 to $342 billion in 2024. [Worldpay]
- Cash's share of global POS payment value fell by nearly two-thirds in 10 years, from 44% in 2014 to 15% in 2024. After this sharp decline, cash often finds a stable position with customers. [Worldpay]
- Used directly and from within digital wallets, cards, including corporate cards, are forecast to account for 56% of global consumer payment value in 2030, or roughly $32.5 trillion. [Worldpay]
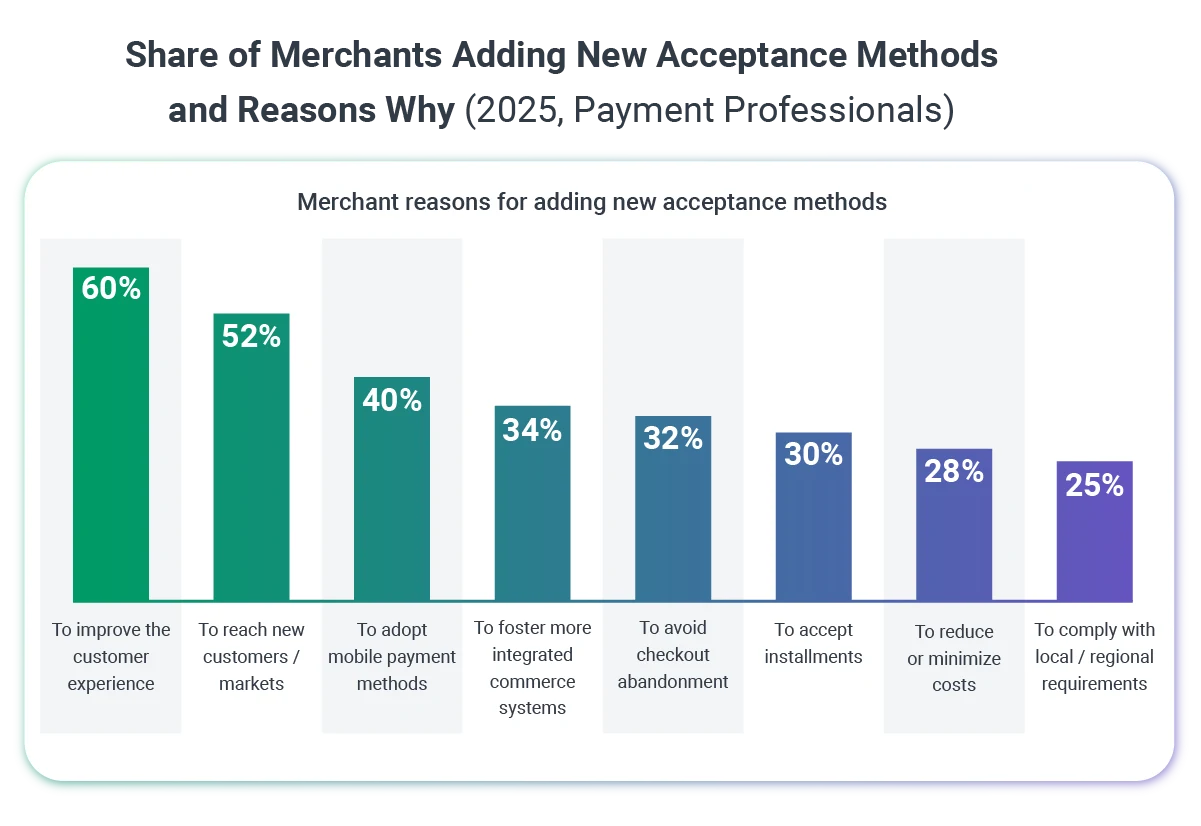
- 74% of merchants added at least one new payment acceptance method in the past 13 months.
3. GENERATIONAL SHIFTS: THE GEN Z EFFECT
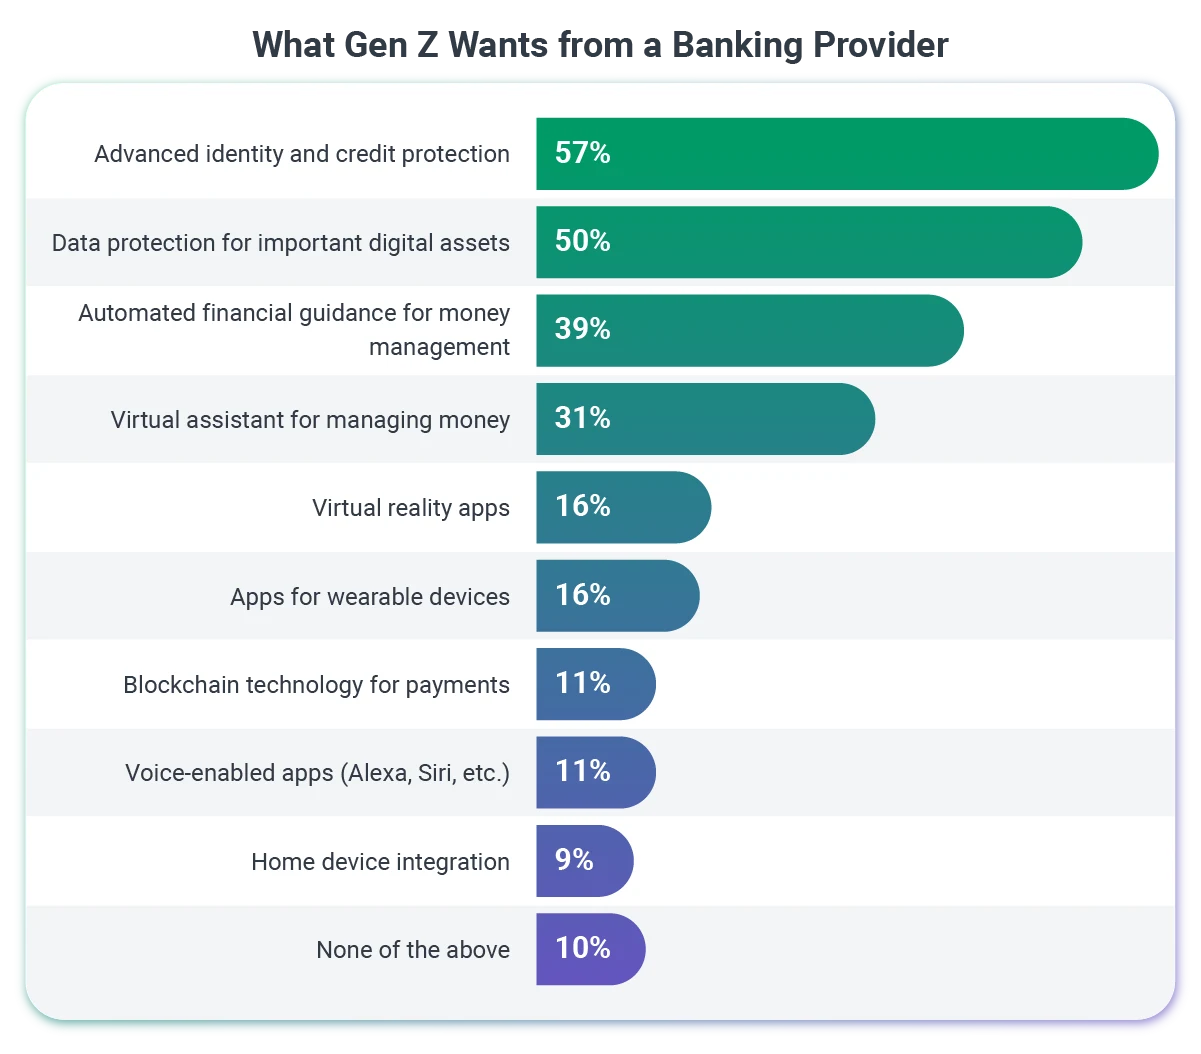
If consumer behavior is changing, Gen Z is rewriting the rulebook entirely. This generation is quickly adapting –and expecting– digital payments.
- Digital payment saturation reaches new heights among Gen Z: 93% use P2P platforms and 91% use mobile wallets, with over 40% using each more than five times monthly, marking digital payments as not just preferred but expected. [BCG + QED]
- Buy Now, Pay Later usage among Gen Z nearly doubled from 26% to 46% in just one year, signaling a dramatic shift in financing preferences that could reshape credit markets. [BCG + QED]
- Digital wallets and cards now account for 92% of Gen Z's preferred payment methods, while cash hits a historic low of just 7%, highlighting a generational break from traditional payments. [BCG + QED]
- 81% of Gen Z would abandon brands over poor payment experiences, with 65% leaving after just 2-3 negative interactions, making payment innovation crucial for customer retention. [BCG + QED]
- Perks and rewards programs play an increasingly important role in customer convenience, with younger consumers like Generation Z showing a strong preference for innovative incentives such as flash sales or exclusive app-based events over traditional cash back rewards. [Worldpay and PYMNTS]
- Gen Z usage of BNPL increased by 10%, even as overall adoption experienced a 10% decline across other demographics. [The Paypers]
- Over 30 million Millennials and 25 million Gen Z consumers in the United States utilized BNPL services in 2024. [The Paypers]
- 75% of millenials would switch their primary bank for a better mobile experience. [CoinLaw]
- For Gen Z, 61% choose to bank at the same financial institution as their parents. [CoinLaw]
4. Merchant Payment Operations & Real-Time Payments
Consumer demand is only half the equation. On the merchant side, real-time payment infrastructure is rapidly becoming the new standard.
- Payment method preferences show clear leaders and declining options. Instant payments dominate at 73% usage, followed closely by B2C payment alternatives at 70%—though this represents a significant 14 percentage point drop from 84% in 2024. [Citizens Bank]
- Traditional methods maintain moderate adoption, with Automated Clearing House at 56%, wire transfers at 55%, and both virtual and physical credit cards tied at 52%. Check usage has declined to 47%. [Citizens Bank]
- Thirty-seven percent of merchants globally currently accept real-time payments, while 42% of those who don't are likely to implement RTP capabilities in 2025. [Merchant Risk Council]
- Among merchants already accepting real-time payments, approximately 80% reported a marked increase in customer usage of this payment method over the past year, and roughly 90% anticipate similar growth next year. [Merchant Risk Council]
- Ninety percent of merchants maintain preferred payment methods that they actively encourage eCommerce customers to use, typically through promotions and incentives offered at checkout. [Merchant Risk Council]
- Companies are at various stages of adopting payment innovations: QR code payments lead with 48% current deployment and another 22% exploring implementation; real-time payments follow closely at 47% adoption with 24% in exploration; contactless and NFC payments show 46% deployment and 29% exploration; Buy Now, Pay Later services stand at 44% deployment with 30% exploring; cryptocurrency and stablecoin options round out the list at 41% deployment and 32% exploration phase. [Endava]
- The urgency around digital payment adoption has intensified significantly year-over-year. Companies planning to transition within the next year declined slightly from 6% to 4%, but near-term commitments within two to three years surged from 38% to 42%. Medium-term plans (three to five years) dropped sharply from 31% to 19%, while the share with no transition plans decreased from 26% to 35%, suggesting a polarization between committed adopters and holdouts. [Citizens Bank]
- SEPA Instant adoption in Europe continues to accelerate, with non-cash payment volumes increasing by 7.4% in the first half of 2024 compared to the same period in 2023, driven by regulatory mandates and increasing consumer demand for faster cross-border payments. [PaymentGenes]
- FedNow in the United States has expanded quickly since its July 2023 launch by the Federal Reserve, with over 1,000 institutions offering the service by the end of 2024. [PaymentGenes]
- India's Unified Payments Interface (UPI) processed approximately 170 billion transactions in 2024, valued at nearly $2.9 trillion, establishing India as a global leader in real-time payment adoption. [PaymentGenes]
- With the Instant Payments Regulation (IPR) approaching implementation, the European Commission has mandated that all banks in the EU be ready to receive instant payments by January 2025 and send them by October 2025. [PaymentGenes]
- The UK's Smart Data Initiative aims to extend Open Banking mandates beyond payments, enabling data-sharing across lending, insurance, and personal finance management. [PaymentGenes]
- Brazil's instant payment system, Pix, recorded 239.9 million transactions on Black Friday 2024, setting a record for the highest number of transactions in a single day. [PaymentGenes]
5. BUSINESS STRATEGIES
As payment infrastructure evolves, businesses are rethinking how they compete. Payment systems have moved from back-office function to strategic differentiator and A2A payments are becoming all the rage.
- 64% of UK and US merchants now view payment systems as a competitive differentiator rather than just an operational necessity. [PXP]
- 49% of businesses are exploring digital wallets, account-to-account (A2A) payments, and BNPL to expand cross-border commerce. [PXP]
- 34% of merchants are expanding their payment method offerings, while 20% are investing in international payment capabilities to cater to global consumers. [PXP]
- 37% of bricks-and-mortar retailers cite system stability as a critical concern, with 30% prioritising a unified payment platform that integrates in-store and online transactions. [PXP]
- Technology budget allocations reveal three clear priorities clustered at the top. Real-time payments and alternative rails lead fintech directors' budget priorities at 39%, followed closely by payment security at 38% and customer-facing platforms like wallets and apps at 35%. [Endava]
- A2A payments can reduce processing costs by up to 30% compared to traditional card-based systems. With direct bank transfers, transaction costs drop to cents or a low flat fee. For example, FedNow transfers cost around $0.04, enabling merchants to save 1-2% or more per transaction and directly boost their bottom line. [PaymentGenes]
- E-invoicing adoption delivers measurable economic and operational benefits. In the U.S., full adoption could generate more than $116 billion, with 83% of these gains—$97 billion—coming from small and medium-sized businesses. [Avalara]
- U.S. businesses save an average of $15.16 per invoice received, the highest among surveyed markets, and receive payments up to 2.5 days faster, representing a 15% improvement over paper or manual digital processes. [Avalara]
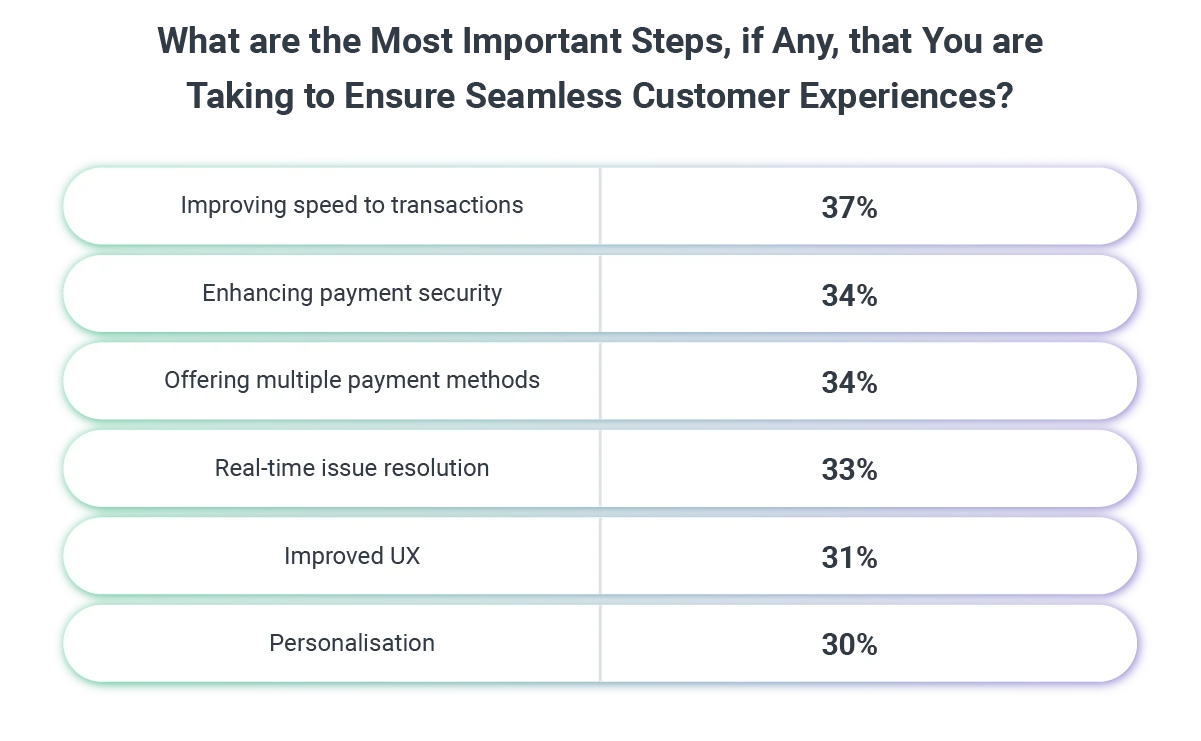
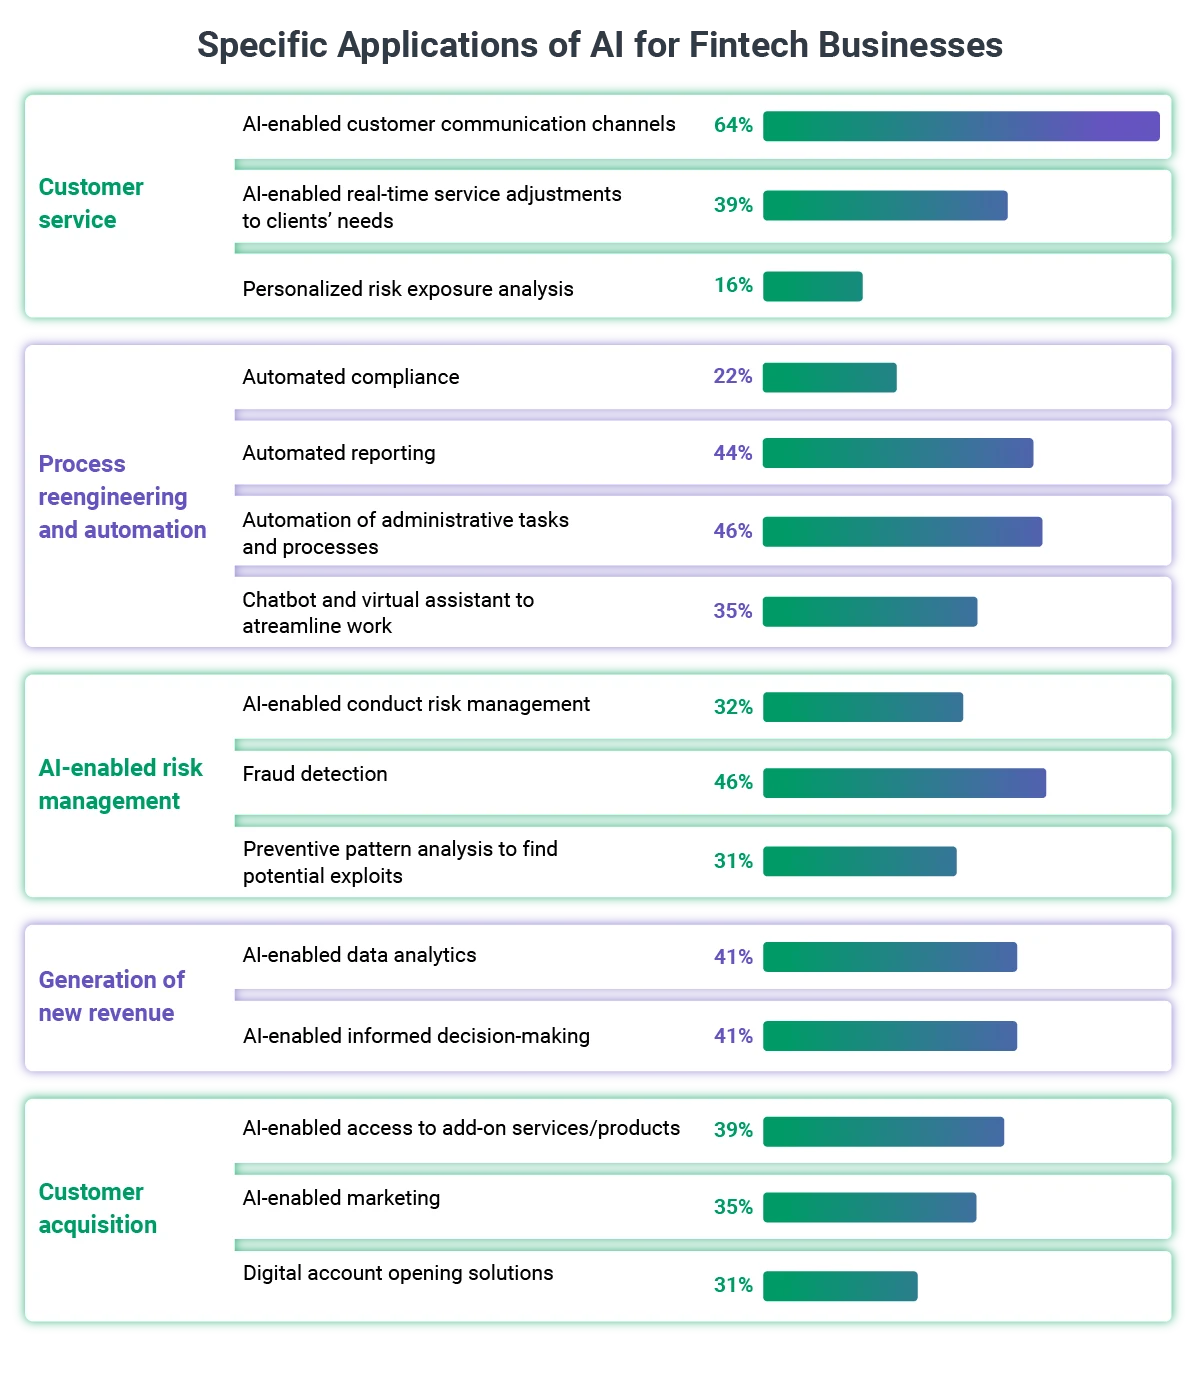
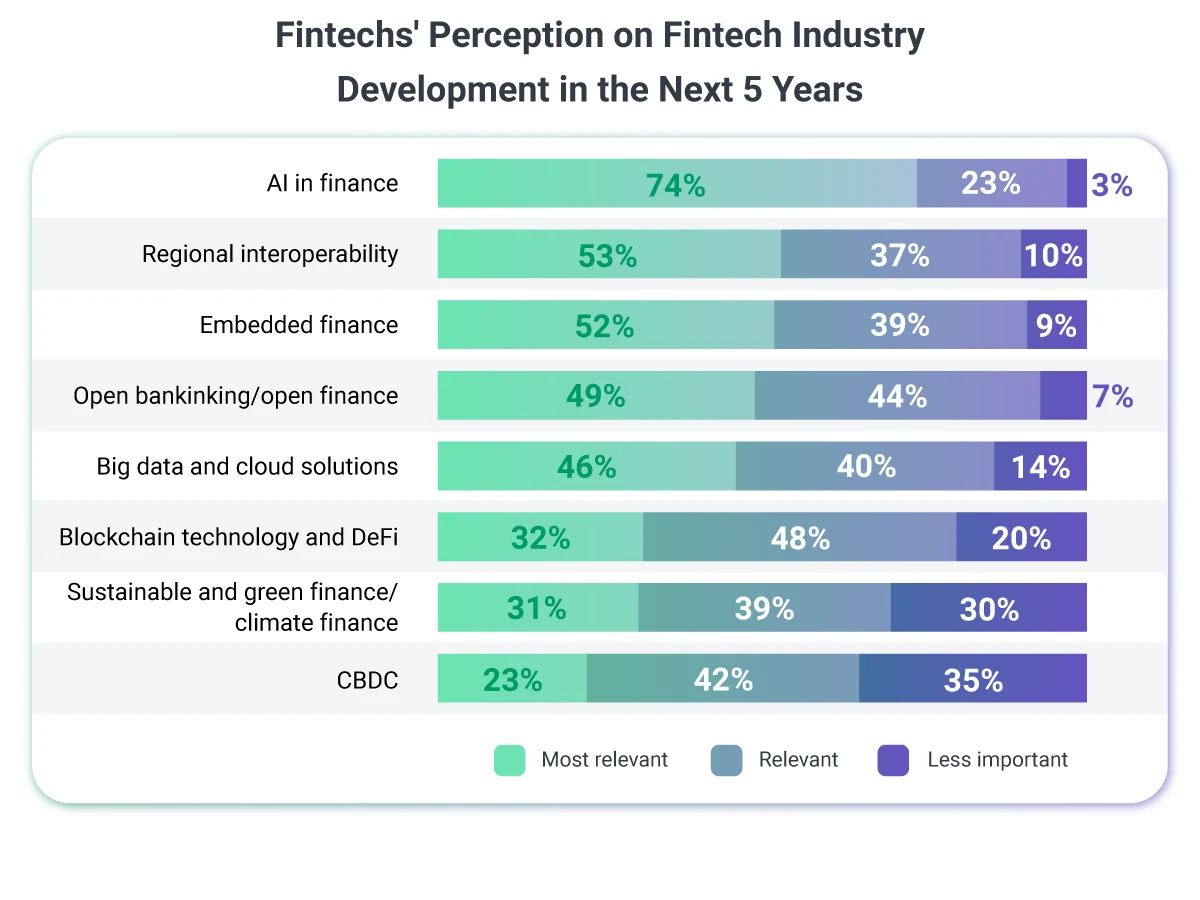
- Fintech companies surveyed are taking a multi-faceted approach to enhancing customer experience and say they are prioritizing the following:
6. AI & GENERATIVE AI ADOPTION
The strategic shift toward digital payments is being supercharged by AI. Here's how fintech companies are embedding artificial intelligence across every layer of their operations:
- 80% of surveyed fintechs are implementing artificial intelligence across multiple business domains, with customer service and process automation leading AI applications at 91% adoption or planned adoption. [World Economic Forum]
- AI implementation is delivering measurable performance benefits for fintechs, with the majority reporting improvements in customer experience (83%), alongside significant gains in both cost reduction and profitability (75% each). [World Economic Forum]
- Data harmonization has become critical for AI implementation, with 80% of firms making moderate-to-large investments in AI this year. [Broadridge]
- Generative AI adoption has surged dramatically: 72% of firms are making moderate-to-large GenAI investments in 2025, up from just 40% in 2024. [Broadridge]
- More than two-thirds (68%) of executives anticipate GenAI will most significantly impact employee productivity, while 35% expect to realize ROI within six months. [Broadridge]
- Sixty-seven percent of executives report personally using GenAI for investment and market research. [Broadridge]
- Nearly two-thirds of CFOs report difficulties integrating AI solutions into their existing technology stacks, with integration challenges particularly acute among goods enterprises, where 78% cite this issue. [PYMNTS]
- Forty-four percent of companies struggle with a lack of AI customization options, with technology firms universally reporting this challenge. [PYMNTS]
- High implementation costs pose a significant barrier, with 89% of service businesses identifying this as a major challenge to AI adoption. [PYMNTS]
- Sixty-eight percent of CFOs are willing to pay for AI solutions that provide real-time visibility into expenditures, underscoring the perceived value of spend-tracking capabilities for financial control. [PYMNTS]
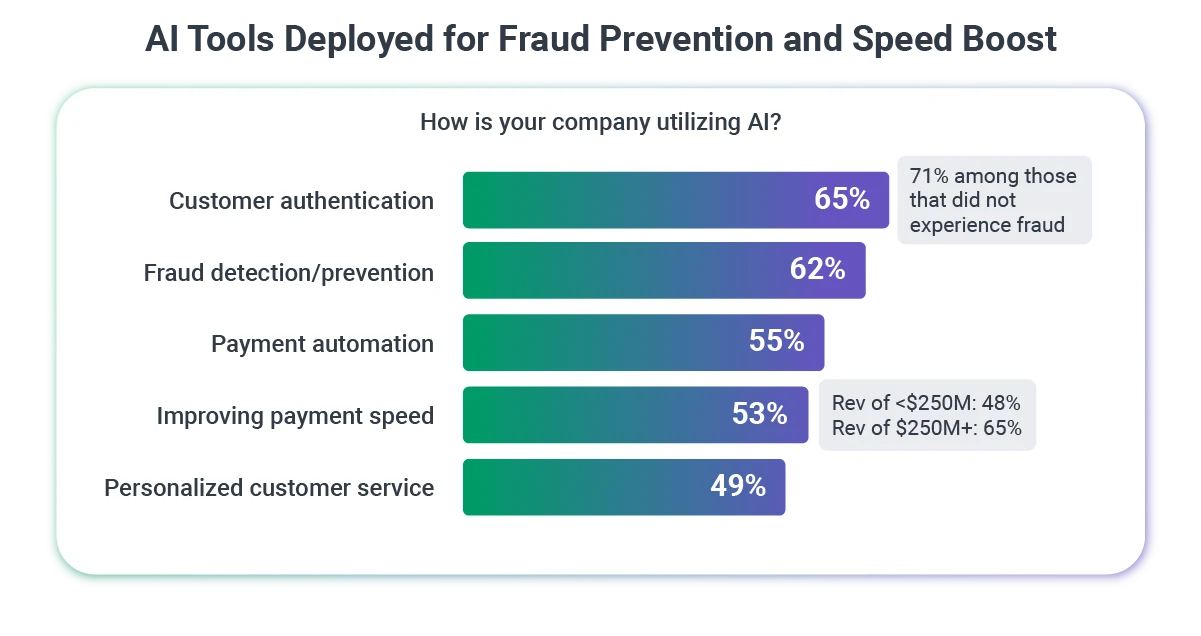
- Sixty-seven percent of CFOs would invest in AI-powered support for vendor negotiations, 60% would prioritize budget optimization capabilities, 55% are interested in AI-driven fraud detection tools, and 52% would invest in predictive analytics capabilities. [PYMNTS]
- According to the 2025 State of AI Cost Management, 80% of enterprises miss their AI infrastructure forecasts by more than 25%, and 84% report significant gross margin erosion tied to AI workloads. [Mavvrik]
7. INFRASTRUCTURE & TECHNOLOGY CHALLENGES
Innovation at this scale doesn't come without friction. Companies face significant regulatory, technical, and operational hurdles as they transform their payment infrastructure.
- Forty-one percent of executives believe their technology strategy isn't advancing quickly enough to meet current demands, while 46% report that legacy systems are undermining their operational resilience. [Broadridge]
- While 58% of technology and operations leaders acknowledge that a well-defined data strategy maximizes ROI on technology investments, 40% concede their organizations struggle with data quality issues. [Broadridge]
- Firms plan to dedicate 29% of their total IT budgets to technology innovation over the next two years—a seven percentage point increase from the previous year. [Broadridge]
- More than 80% of merchants struggle with data and technology challenges, including effectively utilizing data, improving the accuracy of AI and machine learning tools, and overcoming gaps in fraud prevention tool features and capabilities. [Merchant Risk Council]
- An overwhelming 95% of companies express concern about cloud security risks. Protecting data and workloads in multi-tenant cloud environments is a top-of-mind issue for virtually every cloud adopter. The biggest perceived threats include misconfigurations, unauthorized access, and insecure interfaces/APIs. [Tenable]
- About 76% of businesses report a shortage of skilled cloud professionals and experience difficulty hiring or training people for cloud architecture, security, and DevOps roles. This skills gap can hamper cloud adoption for fintechs or lead to misconfigurations. [Cybersecurity Insiders]
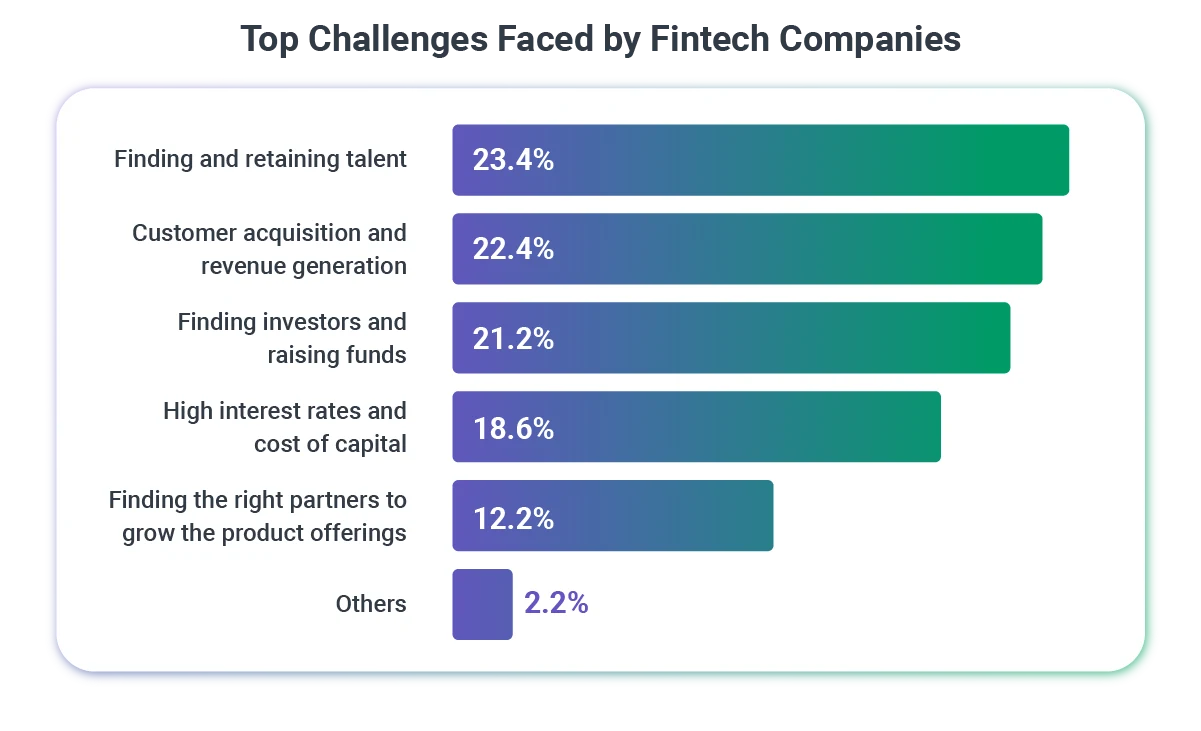
- Finding and retaining talent is the most pressing challenge, affecting 23.4% of fintech companies, as competition for skilled professionals remains intense. [CoinLaw]
- A study found that regulatory compliance issues cause 73% of fintech startups to fail within three years. [Hare Strategy Group]
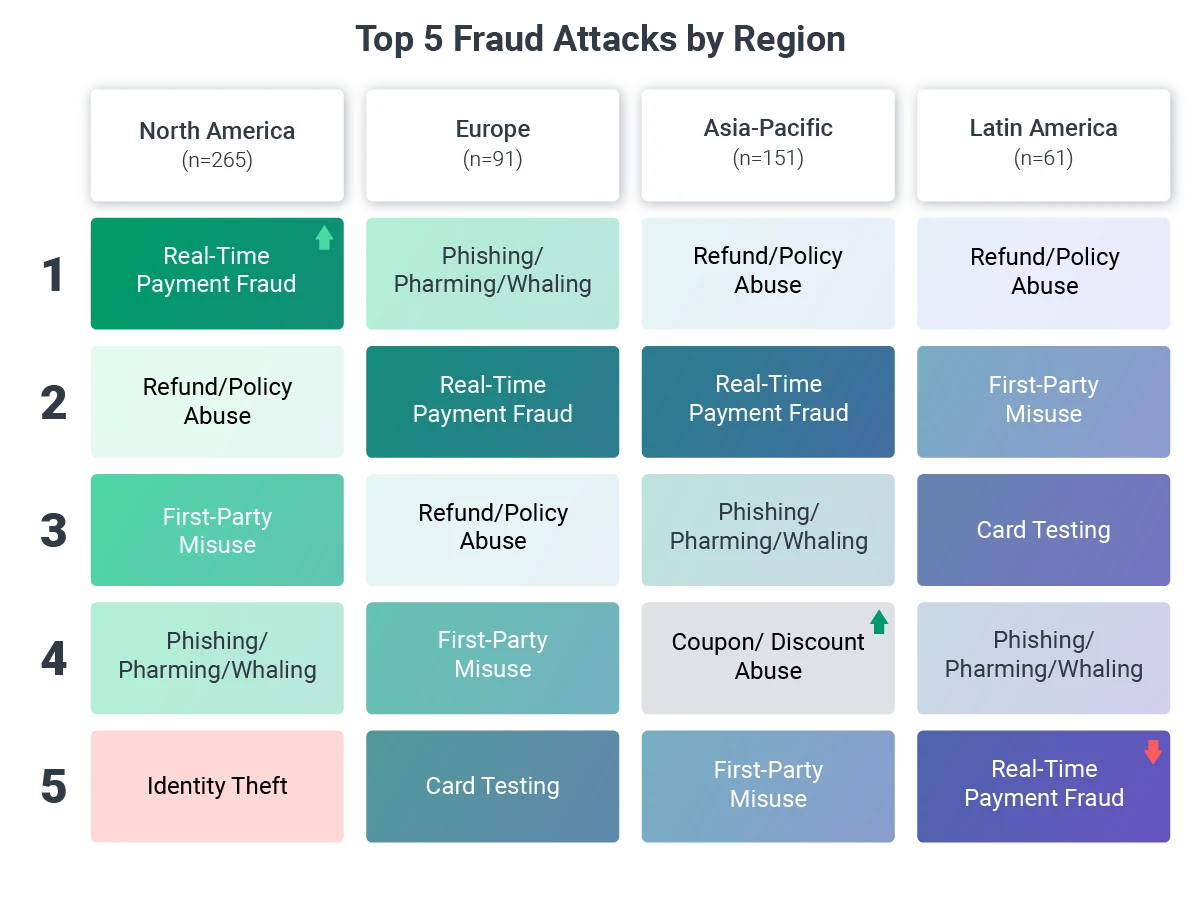
8. FRAUD, SECURITY & RISK MANAGEMENT
Fintech companies are taking fraud and security very seriously, with massive compliance and user consequences to face if they fail.
- 36% of businesses rank security and fraud prevention as their top concern when selecting a payment partner. [PXP]
- Fraud management priorities have evolved considerably over the past four years. Reducing fraud and chargebacks has remained relatively stable at 42% in 2025, while focus on customer experience has declined from 45% to 38% year-over-year. Meanwhile, minimizing fraud-related operational costs has doubled in priority, jumping from 10% in 2024 to 20% in 2025. [Merchant Risk Council]
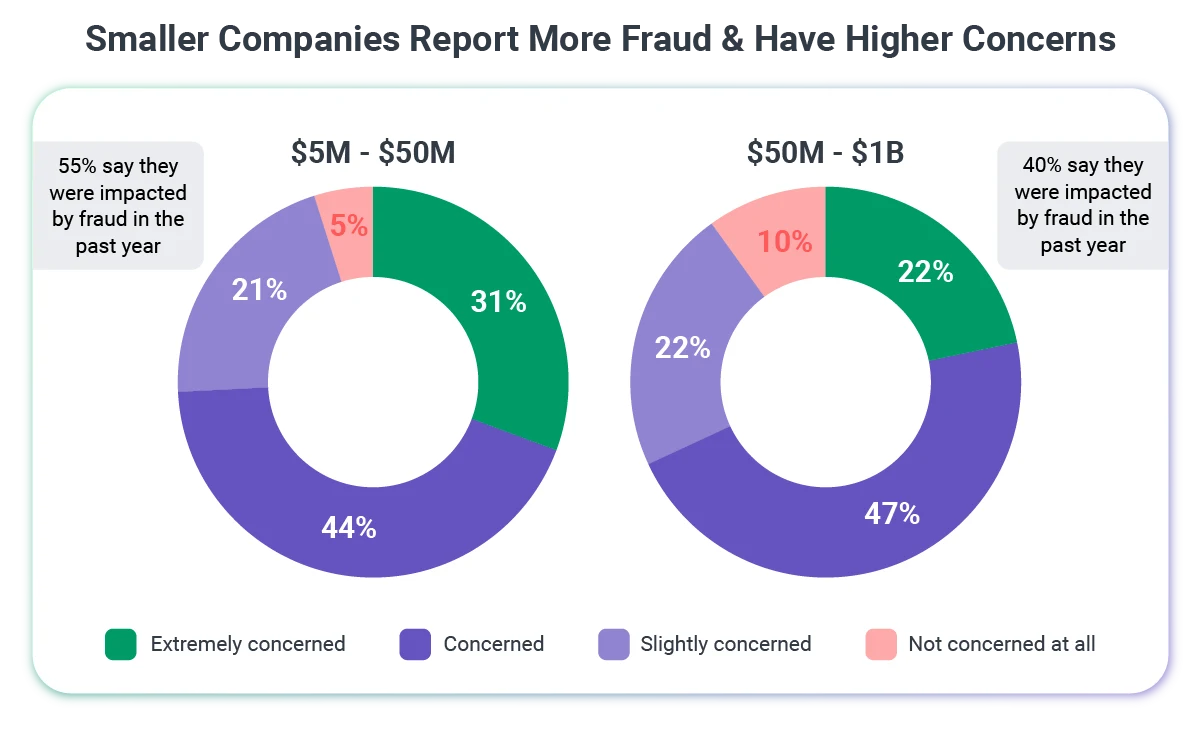
- Smaller companies with $5 million to $50 million in revenue experience higher fraud impact rates, with 55% reporting incidents in the past year. Among these affected companies, concern levels vary significantly: nearly one-third (31%) are extremely concerned, 44% are concerned, 21% are slightly concerned, with the remaining 5% expressing minimal worry. [Merchant Risk Council]
- Larger companies earning $50 million to $1 billion face fraud at lower rates, with 40% reporting incidents. Their concern distribution differs notably: roughly half (47%) are concerned, 22% each are either extremely concerned or slightly concerned, while 10% report no concern at all. [Merchant Risk Council]
- Nearly 90% of merchants now leverage compelling evidence to dispute chargebacks, up from 83% the previous year, with more merchants staying current on the latest regulations and utilizing the full array of relevant data points to combat disputes. [Merchant Risk Council]
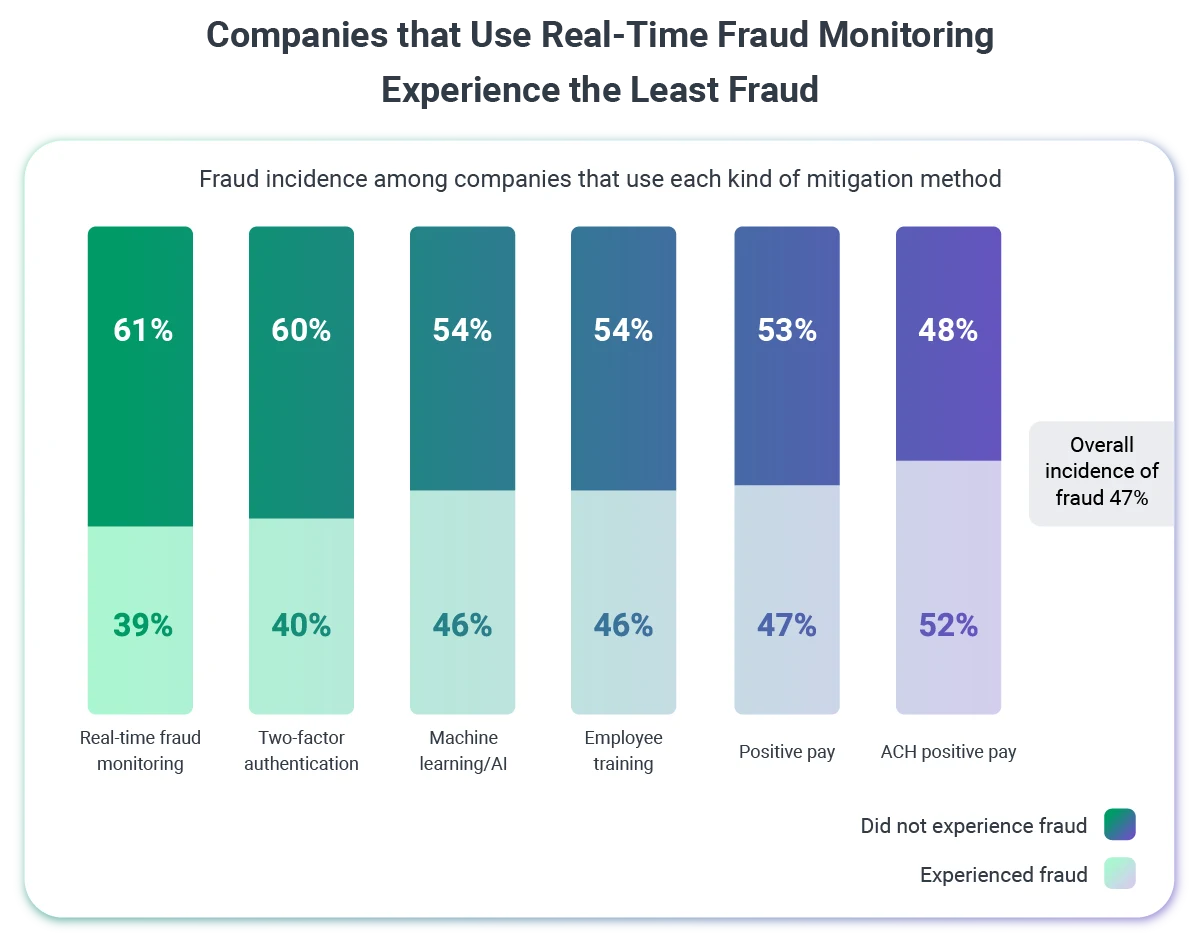
- Most merchants deploy digital fraud monitoring at both the purchase and payment stage of the customer journey, as well as during the refund and dispute stage. Notably, monitoring at the latter stage increased significantly from 45% to 57% over the past year. [Merchant Risk Council]
- Looking ahead, 63% of merchants plan to increase spending on fraud prevention tools and technologies over the next two years, while only half expect to boost investments in staff or talent for this area. [Merchant Risk Council]
- 82% of U.S.-based eCommerce merchants with international sales experienced cyber or data breaches in the past year. [Worldpay and PYMNTS]
- 84% of consumers would switch banks if their previous bank was linked to financial crime, and 87% would actively warn family and friends against using that institution. [ThetaRay]
- Legacy, rule-based AML systems may not be strong enough to prevent fraud and have been found to generate false positives at rates as high as 90–95%, overwhelming teams and frustrating legitimate customers. Reducing this risk requires a new generation of AI-powered solutions that deliver sharper detection without compromising customer experience. [Datos Insights]
- Global card-not-present (CNP) fraud losses are projected to hit $49 billion by 2030. A2A payments help mitigate this risk by eliminating the need for card networks and reducing the potential for chargebacks. [PaymentGenes]
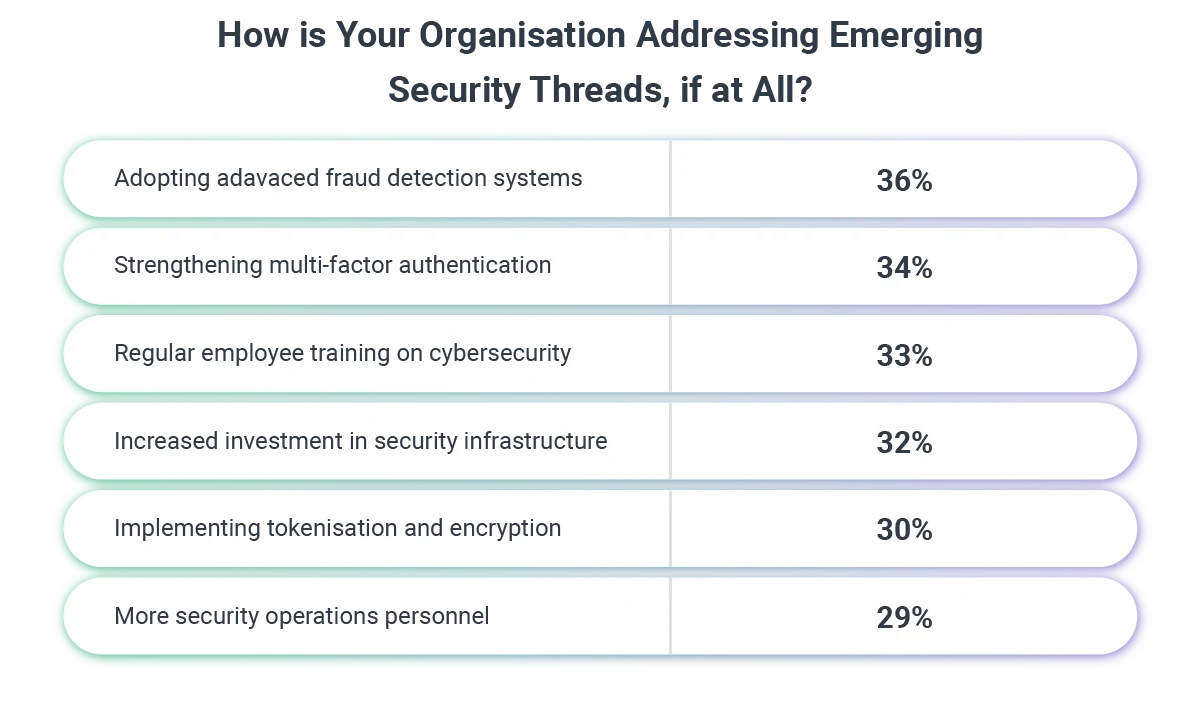
9. EMERGING TECHNOLOGIES & MARKETS
Beyond the mainstream innovations, emerging technologies are creating entirely new payment categories. BNPL, blockchain, and CBDCs are moving from experiment to infrastructure.
- The global Buy Now, Pay Later market is projected to reach $343.52 billion in 2025, representing a 48.4% compound annual growth rate. [The Paypers]
- The U.S. BNPL market is expected to hit $122.26 billion, growing 12.2% year-over-year. [The Paypers]
- The Asia-Pacific region leads in BNPL adoption rates, with more than 20% of consumers using BNPL services on a weekly basis. [The Paypers]
- Regulatory scrutiny of BNPL providers is intensifying, with authorities focusing on consumer protection measures and ensuring sustainable market growth. [The Paypers]
- Seventy-one percent of firms are making major investments in blockchain and distributed ledger technologies this year, compared to 59% in 2024. [Broadridge]
- Half of all executives predict significant adoption of digital assets and ledger technology within capital markets over the coming years. [Broadridge]
- Seventy-three percent of executives anticipate increased regulatory oversight and governance requirements for digital assets going forward. [Broadridge]
- 137 countries and currency unions (representing 98% of global GDP) are exploring a CBDC. In May 2020 that number was only 35. Currently, 72 countries are in the advanced phase of exploration—development, pilot, or launch. [Atlantic Council]
- Countries are taking a phased approach to piloting their CBDCs, using controlled environments like regulatory sandboxes to gradually test and scale implementation. This progressive rollout allows them to assess technological resilience, address privacy and security concerns, evaluate user adoption, and ensure interoperability with existing financial systems. [Atlantic Council]
10. CROSS-BORDER & GLOBAL TRENDS
Finally, let's zoom out to the global picture. Cross-border payments are exploding, and different regions are taking dramatically different paths to digital transformation.
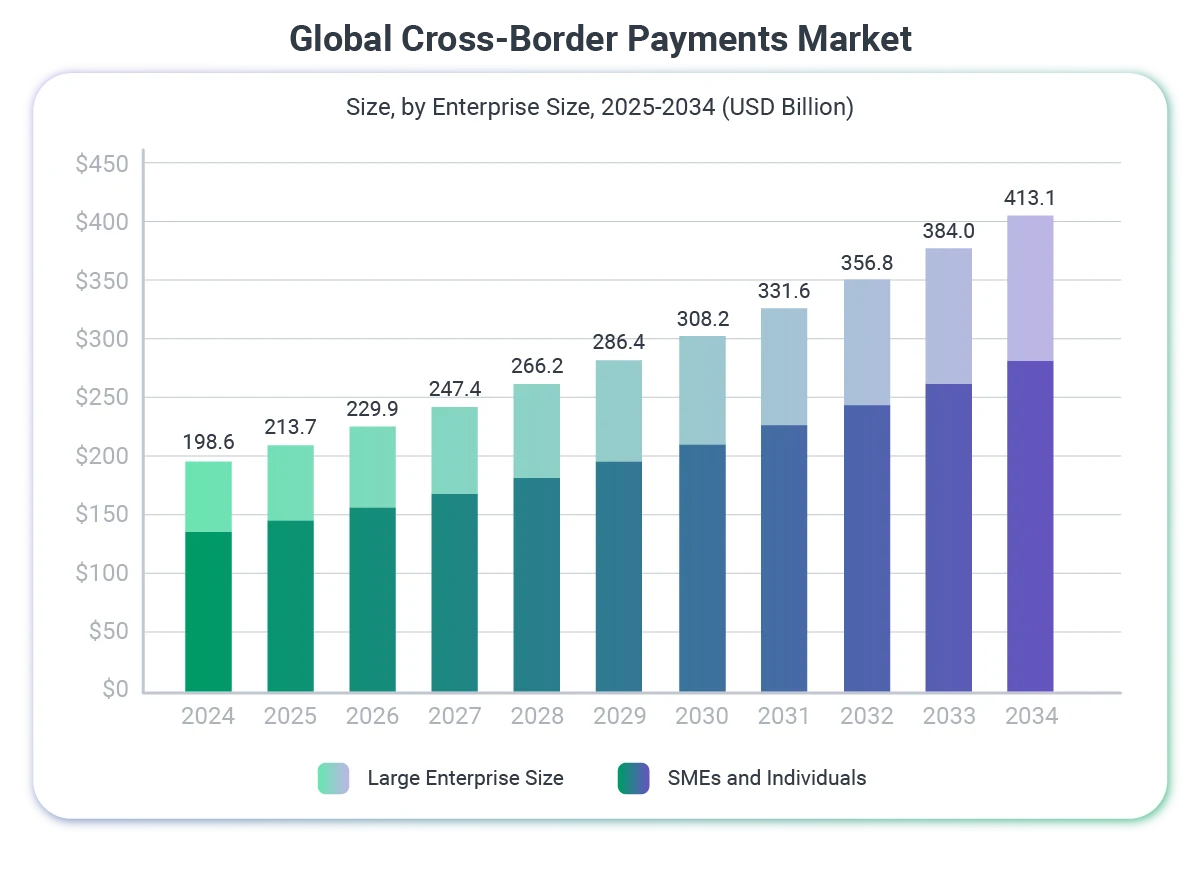
- Cross-border spending continues to grow despite economic uncertainty, projected to increase from $194.6 trillion in 2024 to $320 trillion by 2032, reflecting significant shifts that are reshaping business models, technological capabilities, and the global money movement. [FXC Intel]
- The Federal Reserve's FedNow Service will increase its network transaction limit from $1 million to $10 million in November 2025 to accommodate growing commercial demand for higher-value instant payments. The service currently has more than 1,400 participating organizations across all 50 states. [Federal Reserve]
- Driven by Pix, A2A e-commerce payment value in Brazil jumped from $1 billion in 2014 to $35 billion in 2024. [PaymentGenes]
- Global A2A value is forecast to reach $3.8 trillion by 2030. [Worldpay]
- North America is undergoing a dramatic payment transformation. Digital payment methods at point of sale are projected to more than triple their market share, rising from just 21% in 2014 to half of all transactions by 2024, and reaching nearly two-thirds (65%) by 2030. Correspondingly, traditional cash and card payments will decline from 79% to 35% over the same period. [Worldpay]
- Europe is following a similar but more accelerated trajectory. Digital payment adoption is forecast to jump from 19% in 2014 to 59% by 2024, ultimately capturing three-quarters (75%) of the market by 2030. Traditional payment methods will see a mirror decline from 81% to just 25% over this timeframe. [Worldpay]
Final Word
The companies winning in fintech aren't the ones with the biggest legacy systems but the ones moving fastest to replace them. They're making bold bets on real-time infrastructure, AI-powered experiences, and payment methods their customers actually want to use. They're disrupting their own business models before someone else does it for them.
If you're navigating this transformation and need a partner who understands both the technology and the strategy, we're here to help. Our team specializes in fintech innovation, payment systems, and digital transformation.
Let's talk about how to position your organization for what's coming next. Get in touch →